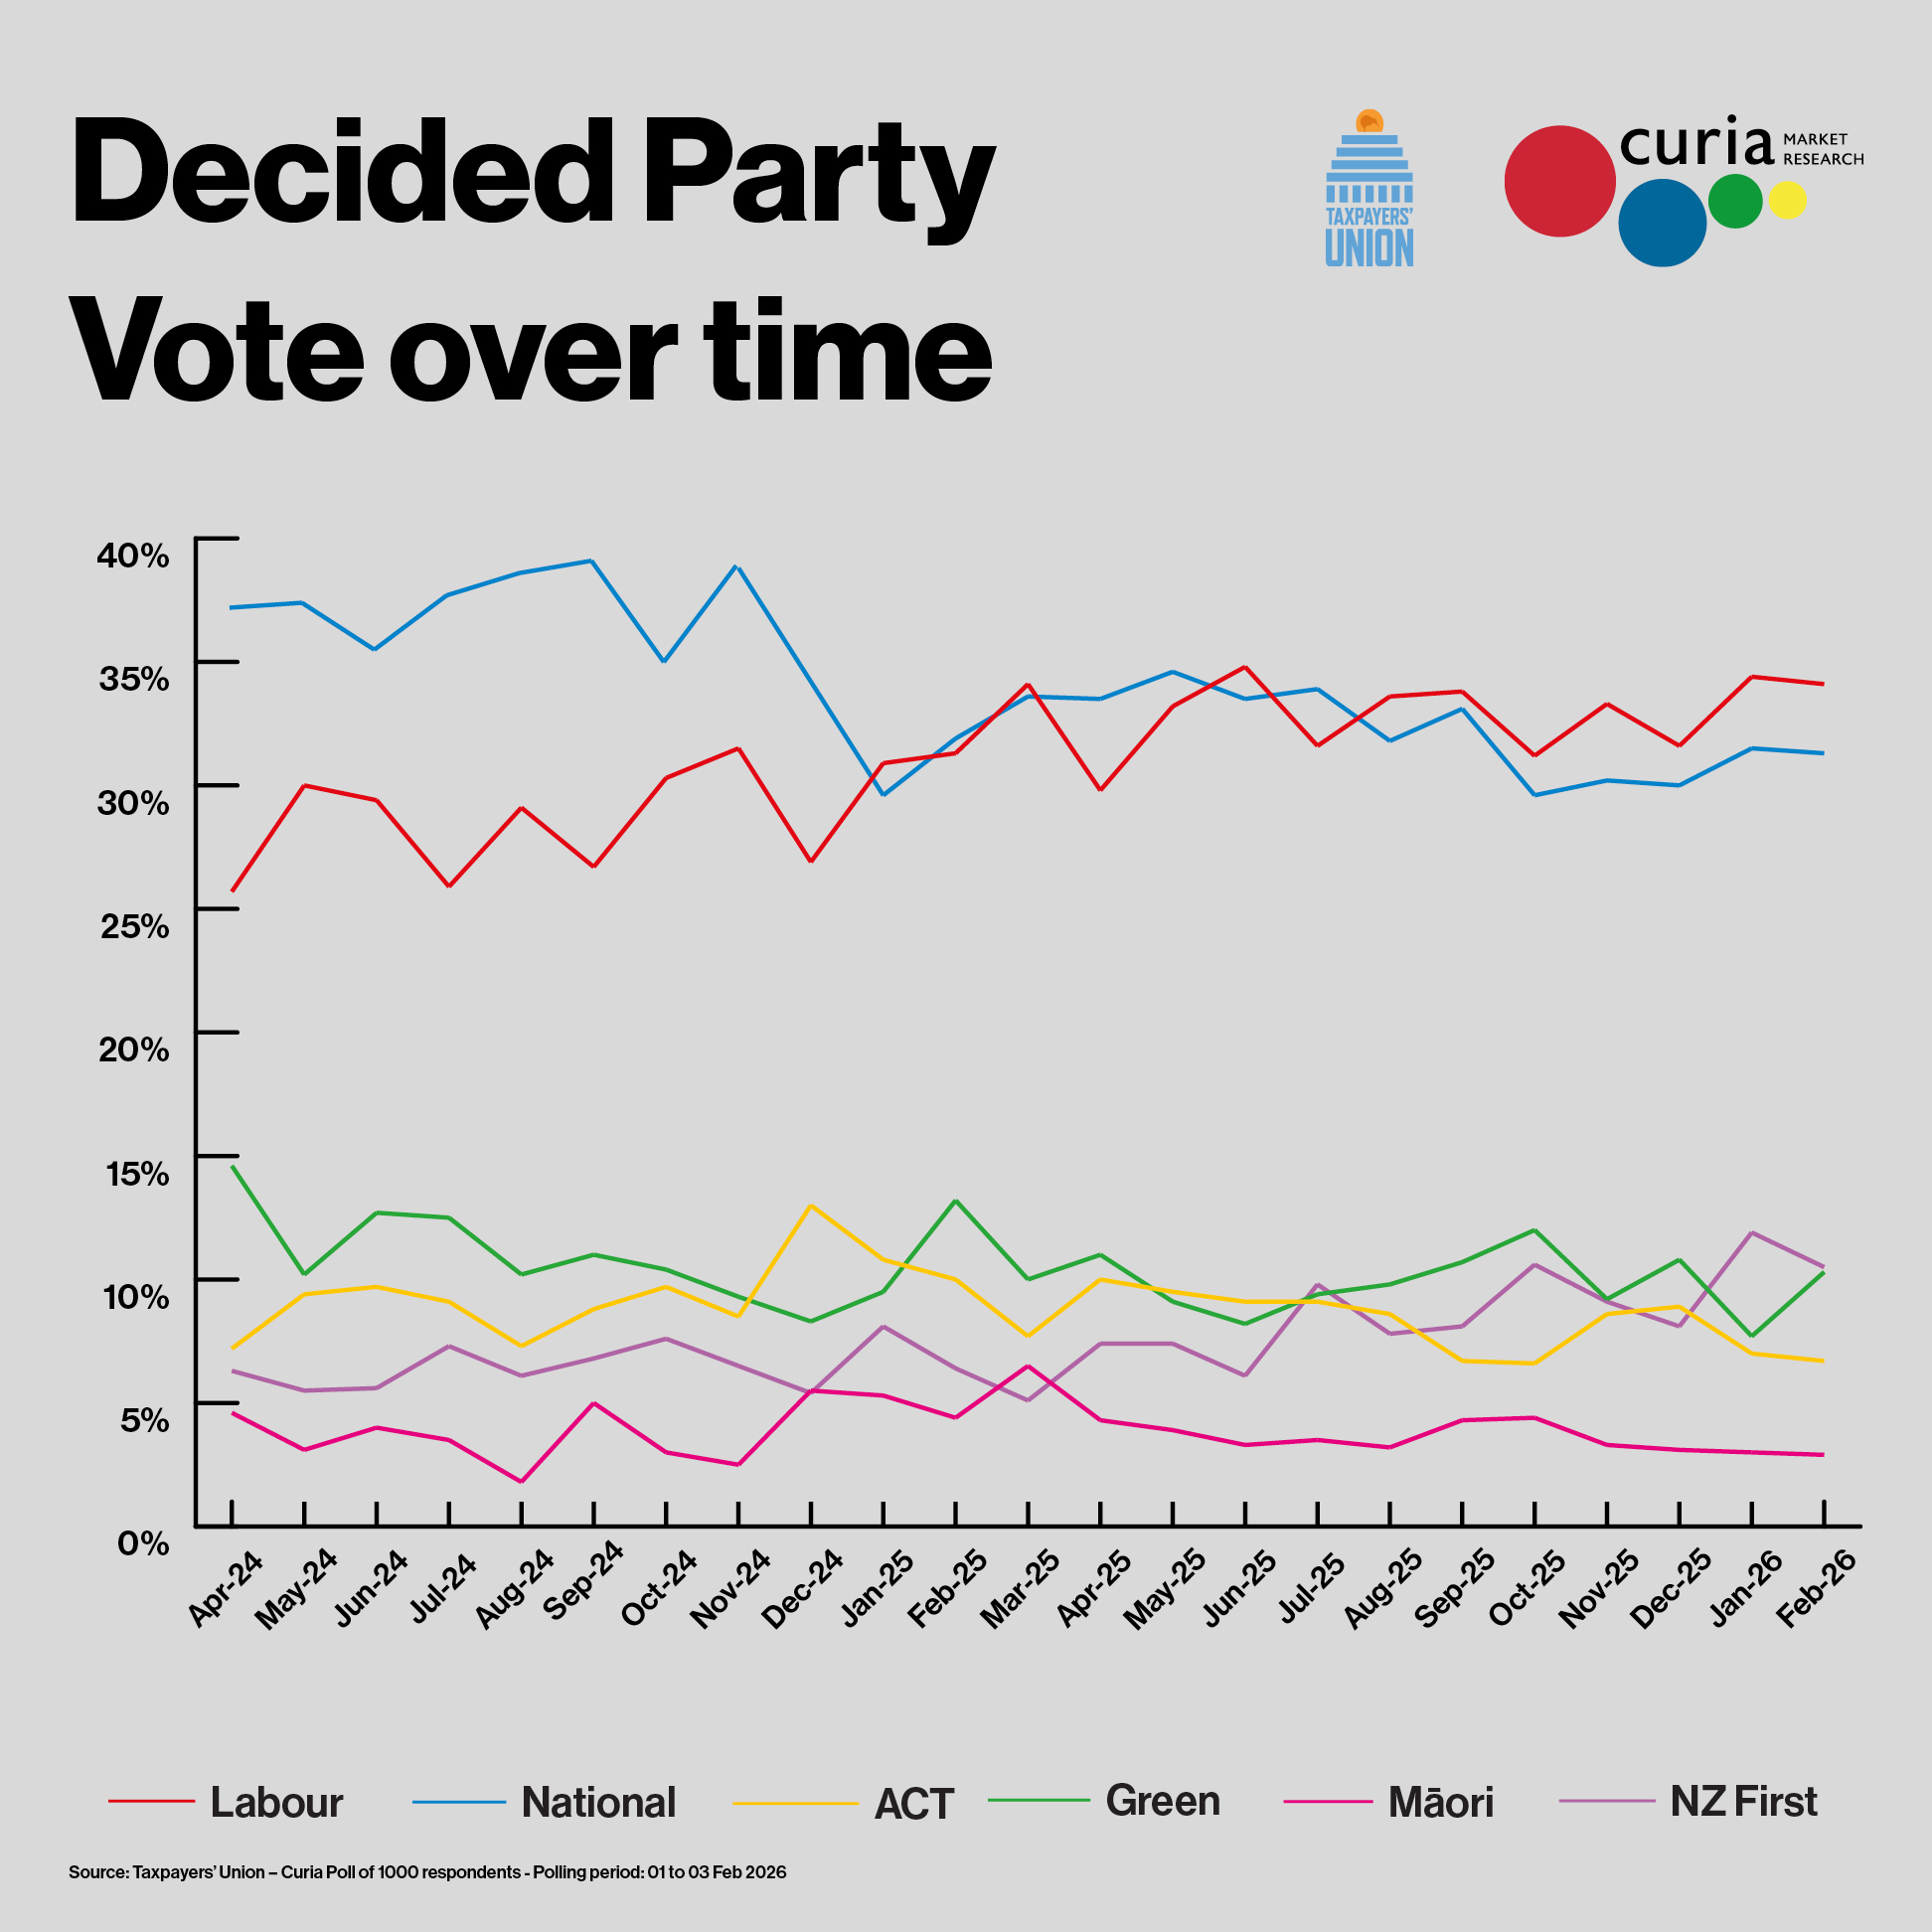
Here are the headline results for February's Taxpayers’ Union – Curia Poll:
|
Party |
Support |
Change compared to January 2026 |
|
Labour |
34.1% |
↓0.3 |
|
National |
31.3% |
↓0.2 |
|
NZ First |
10.5% |
↓1.4 |
|
Green |
10.3% | ↑2.6 |
|
ACT |
6.7% |
↓0.3 |
|
Māori |
2.9% |
↓0.1 |
|
Other |
4.2% |
↓0.3 |
Labour is down 0.3 points to 34.1%, while National is down 0.2 points to 31.3%. NZ First is down 1.4 points to 10.5%, while the Greens are up 2.6 points to 10.3%. ACT is down 0.3 points to 6.7%, while Te Pāti Māori is down 0.1 points to 2.9%.
Minor parties were TOP on 1.4% (+0.7 points), NZ Outdoors and Freedom on 1.2% (+0.6 points), Vision NZ on 0.4% (+0.1 points), and New Conservatives on 0.1% (-0.2 points).
|
Party |
Seats |
Change compared to January 2026 |
|
Labour |
43 |
NC |
|
National |
39 |
NC |
|
NZ First |
13 |
↓2 |
|
Green |
13 |
↑3 |
|
ACT |
8 | ↓1 |
|
Māori |
4 |
NC |
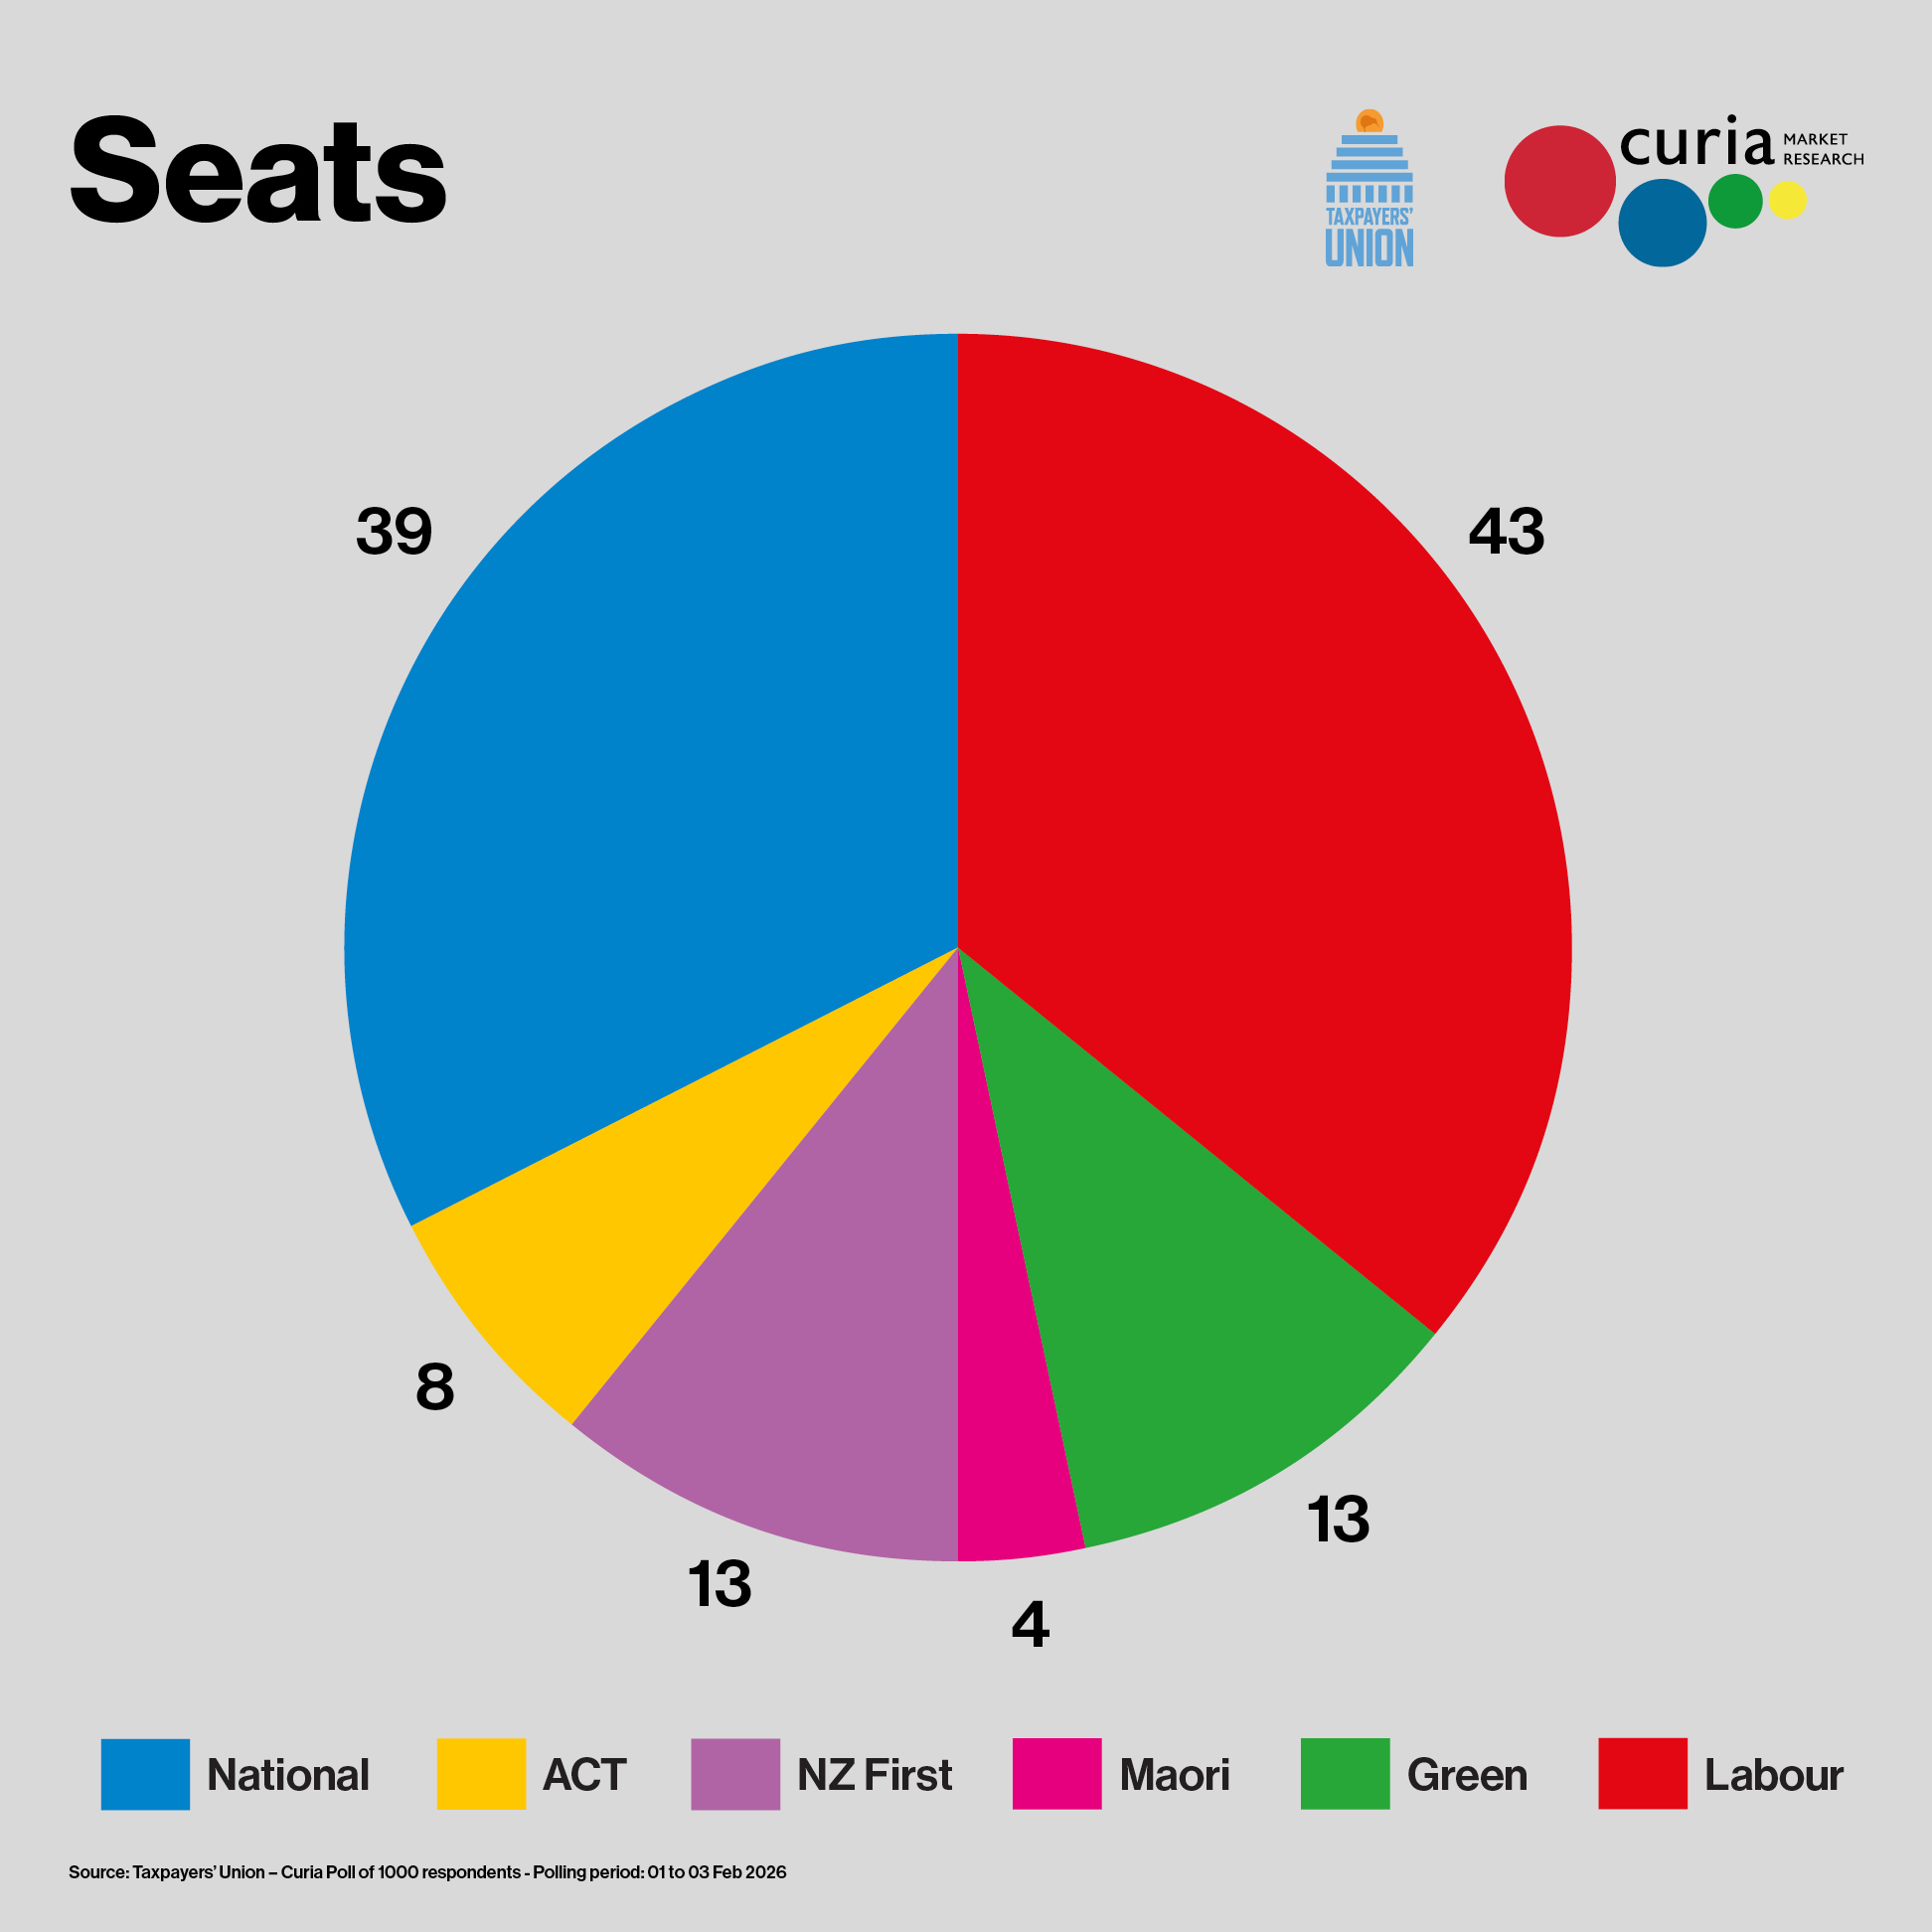
This shows how many seats each party would win in Parliament, based on the decided vote.
Labour remains on 43 seats, while National remains on 39 seats.
NZ First drops 2 seats to 13, while the Greens gain 3 seats to 13.
ACT drops 1 seat to 8, while Te Pāti Māori remains on 4 seats.
This calculation assumes there are no overhang seats for National and Te Pāti Māori. An explainer for this assumption can be found at https://www.kiwiblog.co.nz/2025/11/a_change_to_curias_assumptions_on_electorate_seats.html
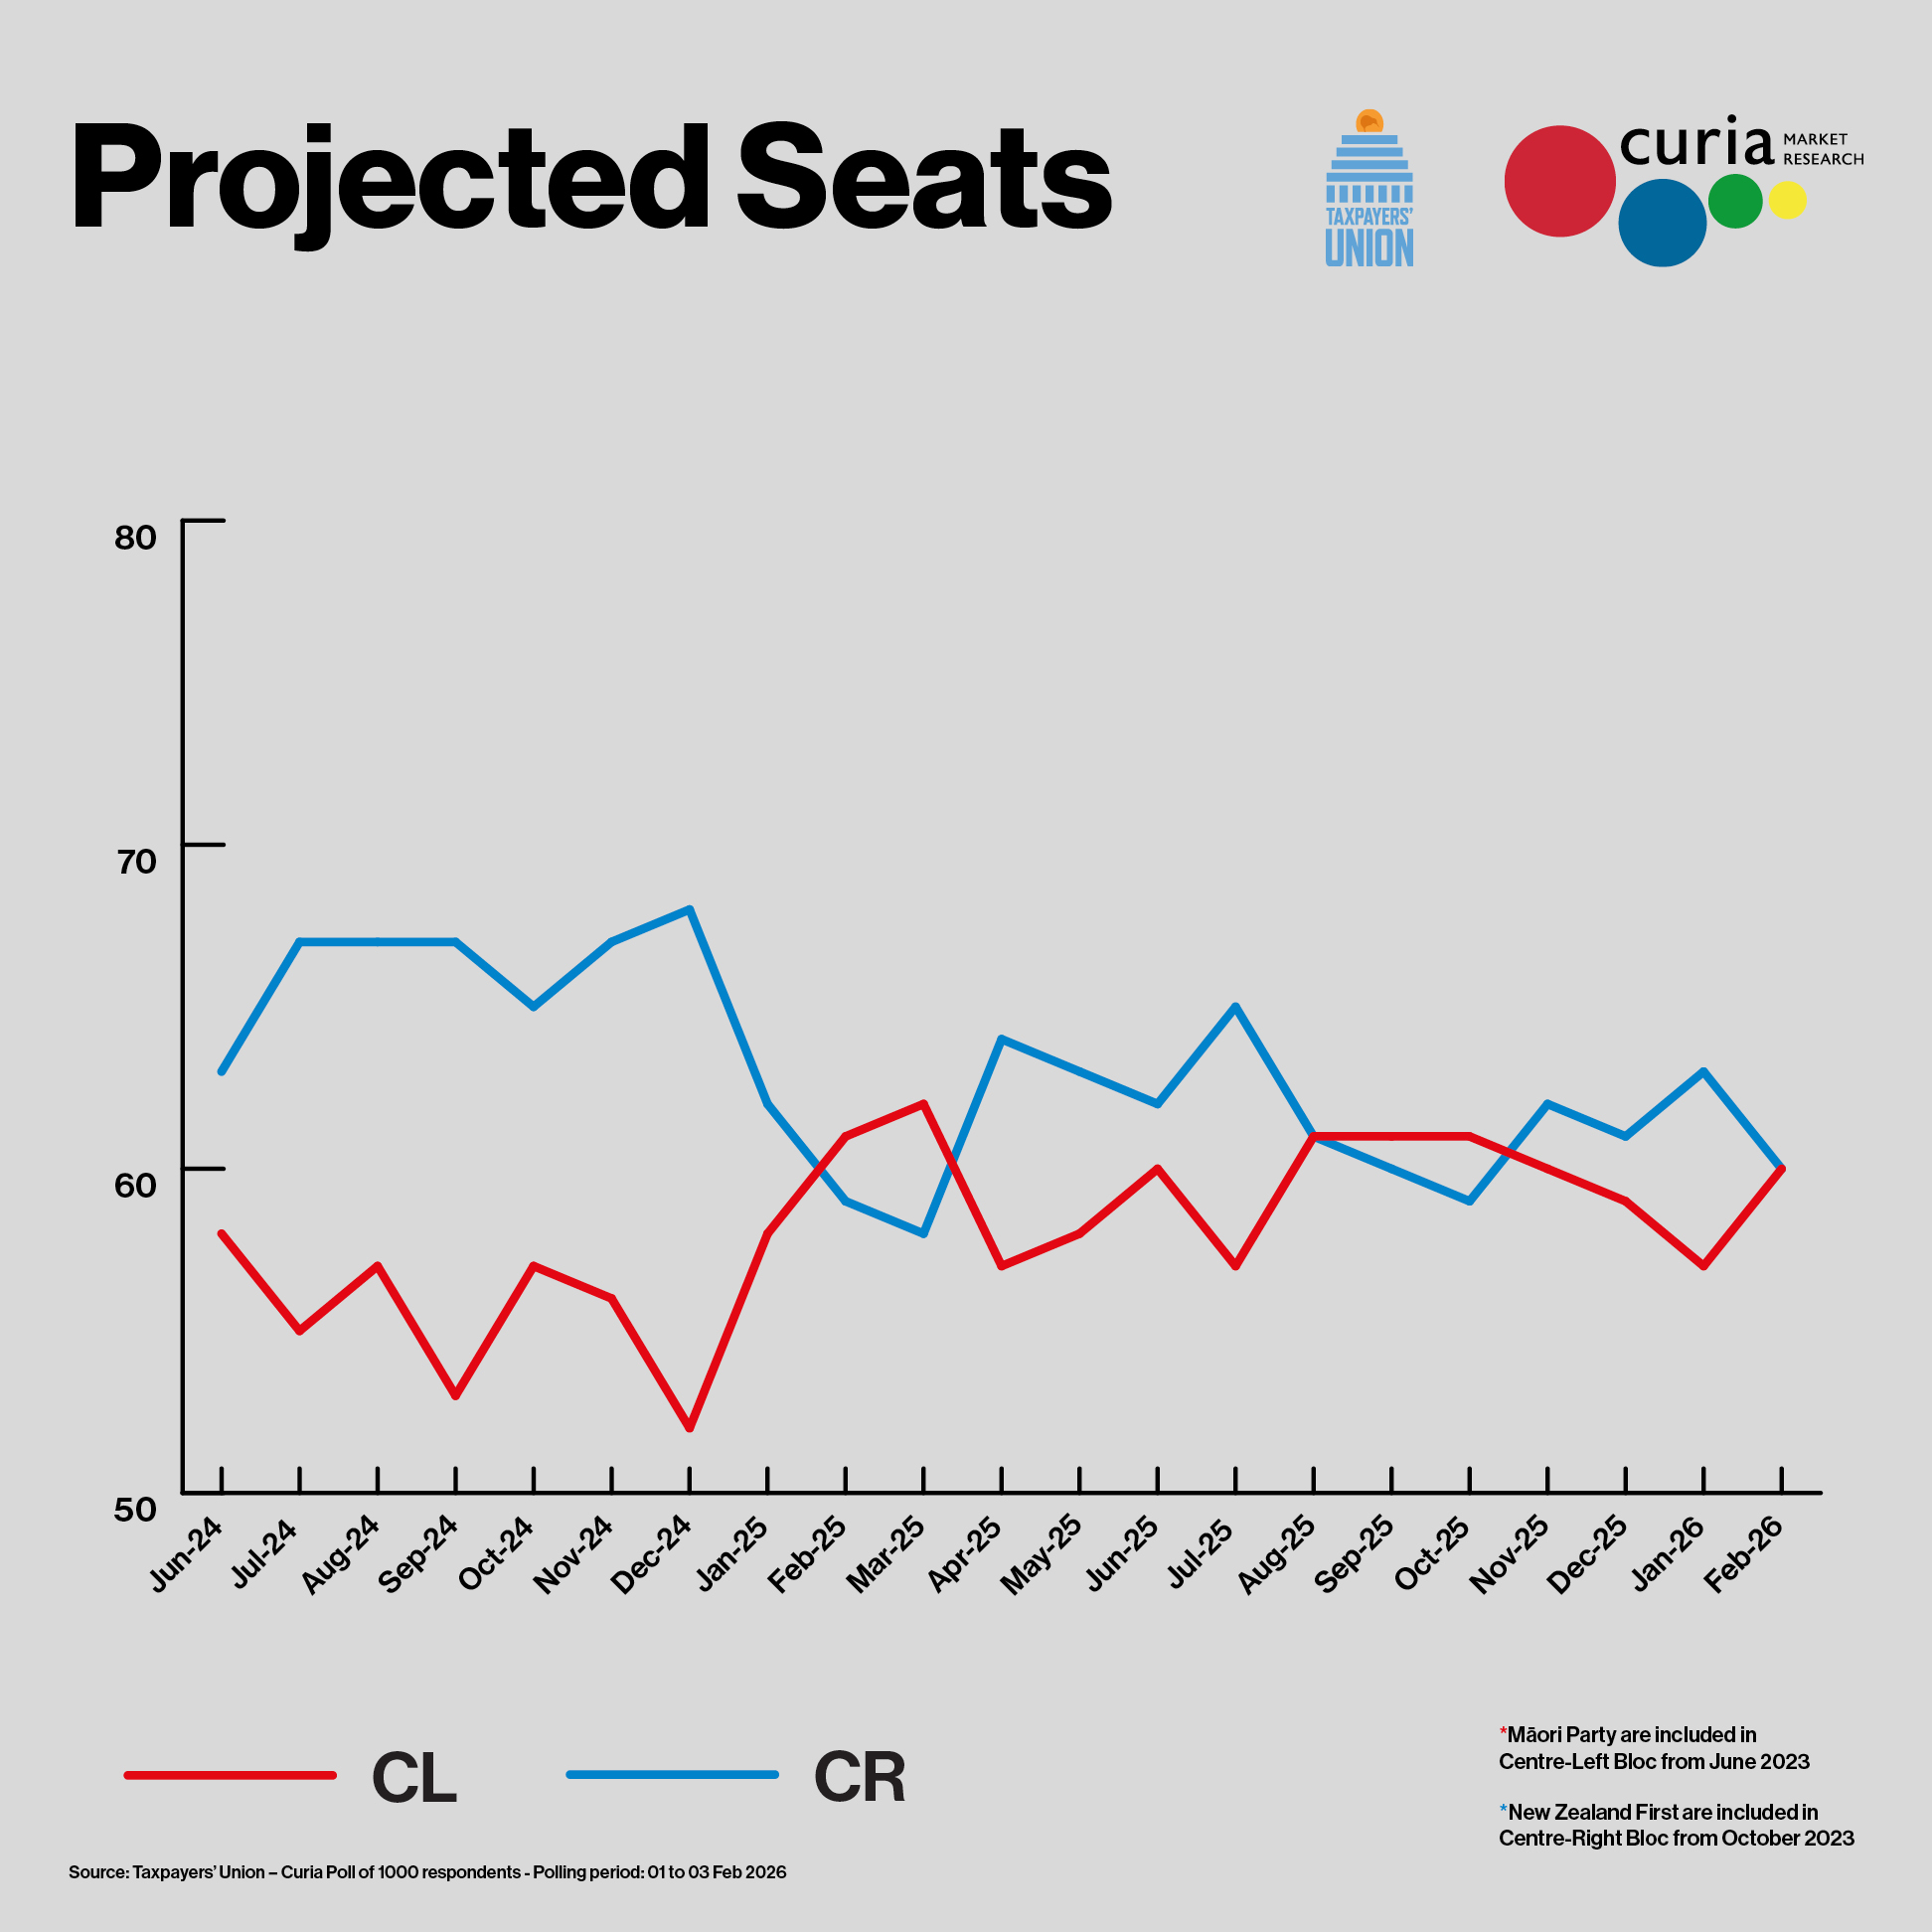
The combined projected seats for the Centre-Right drops 3 seats to 60. The combined seats for the Centre-Left increases 3 seats to 60.
On these numbers, there would be a hung Parliament.
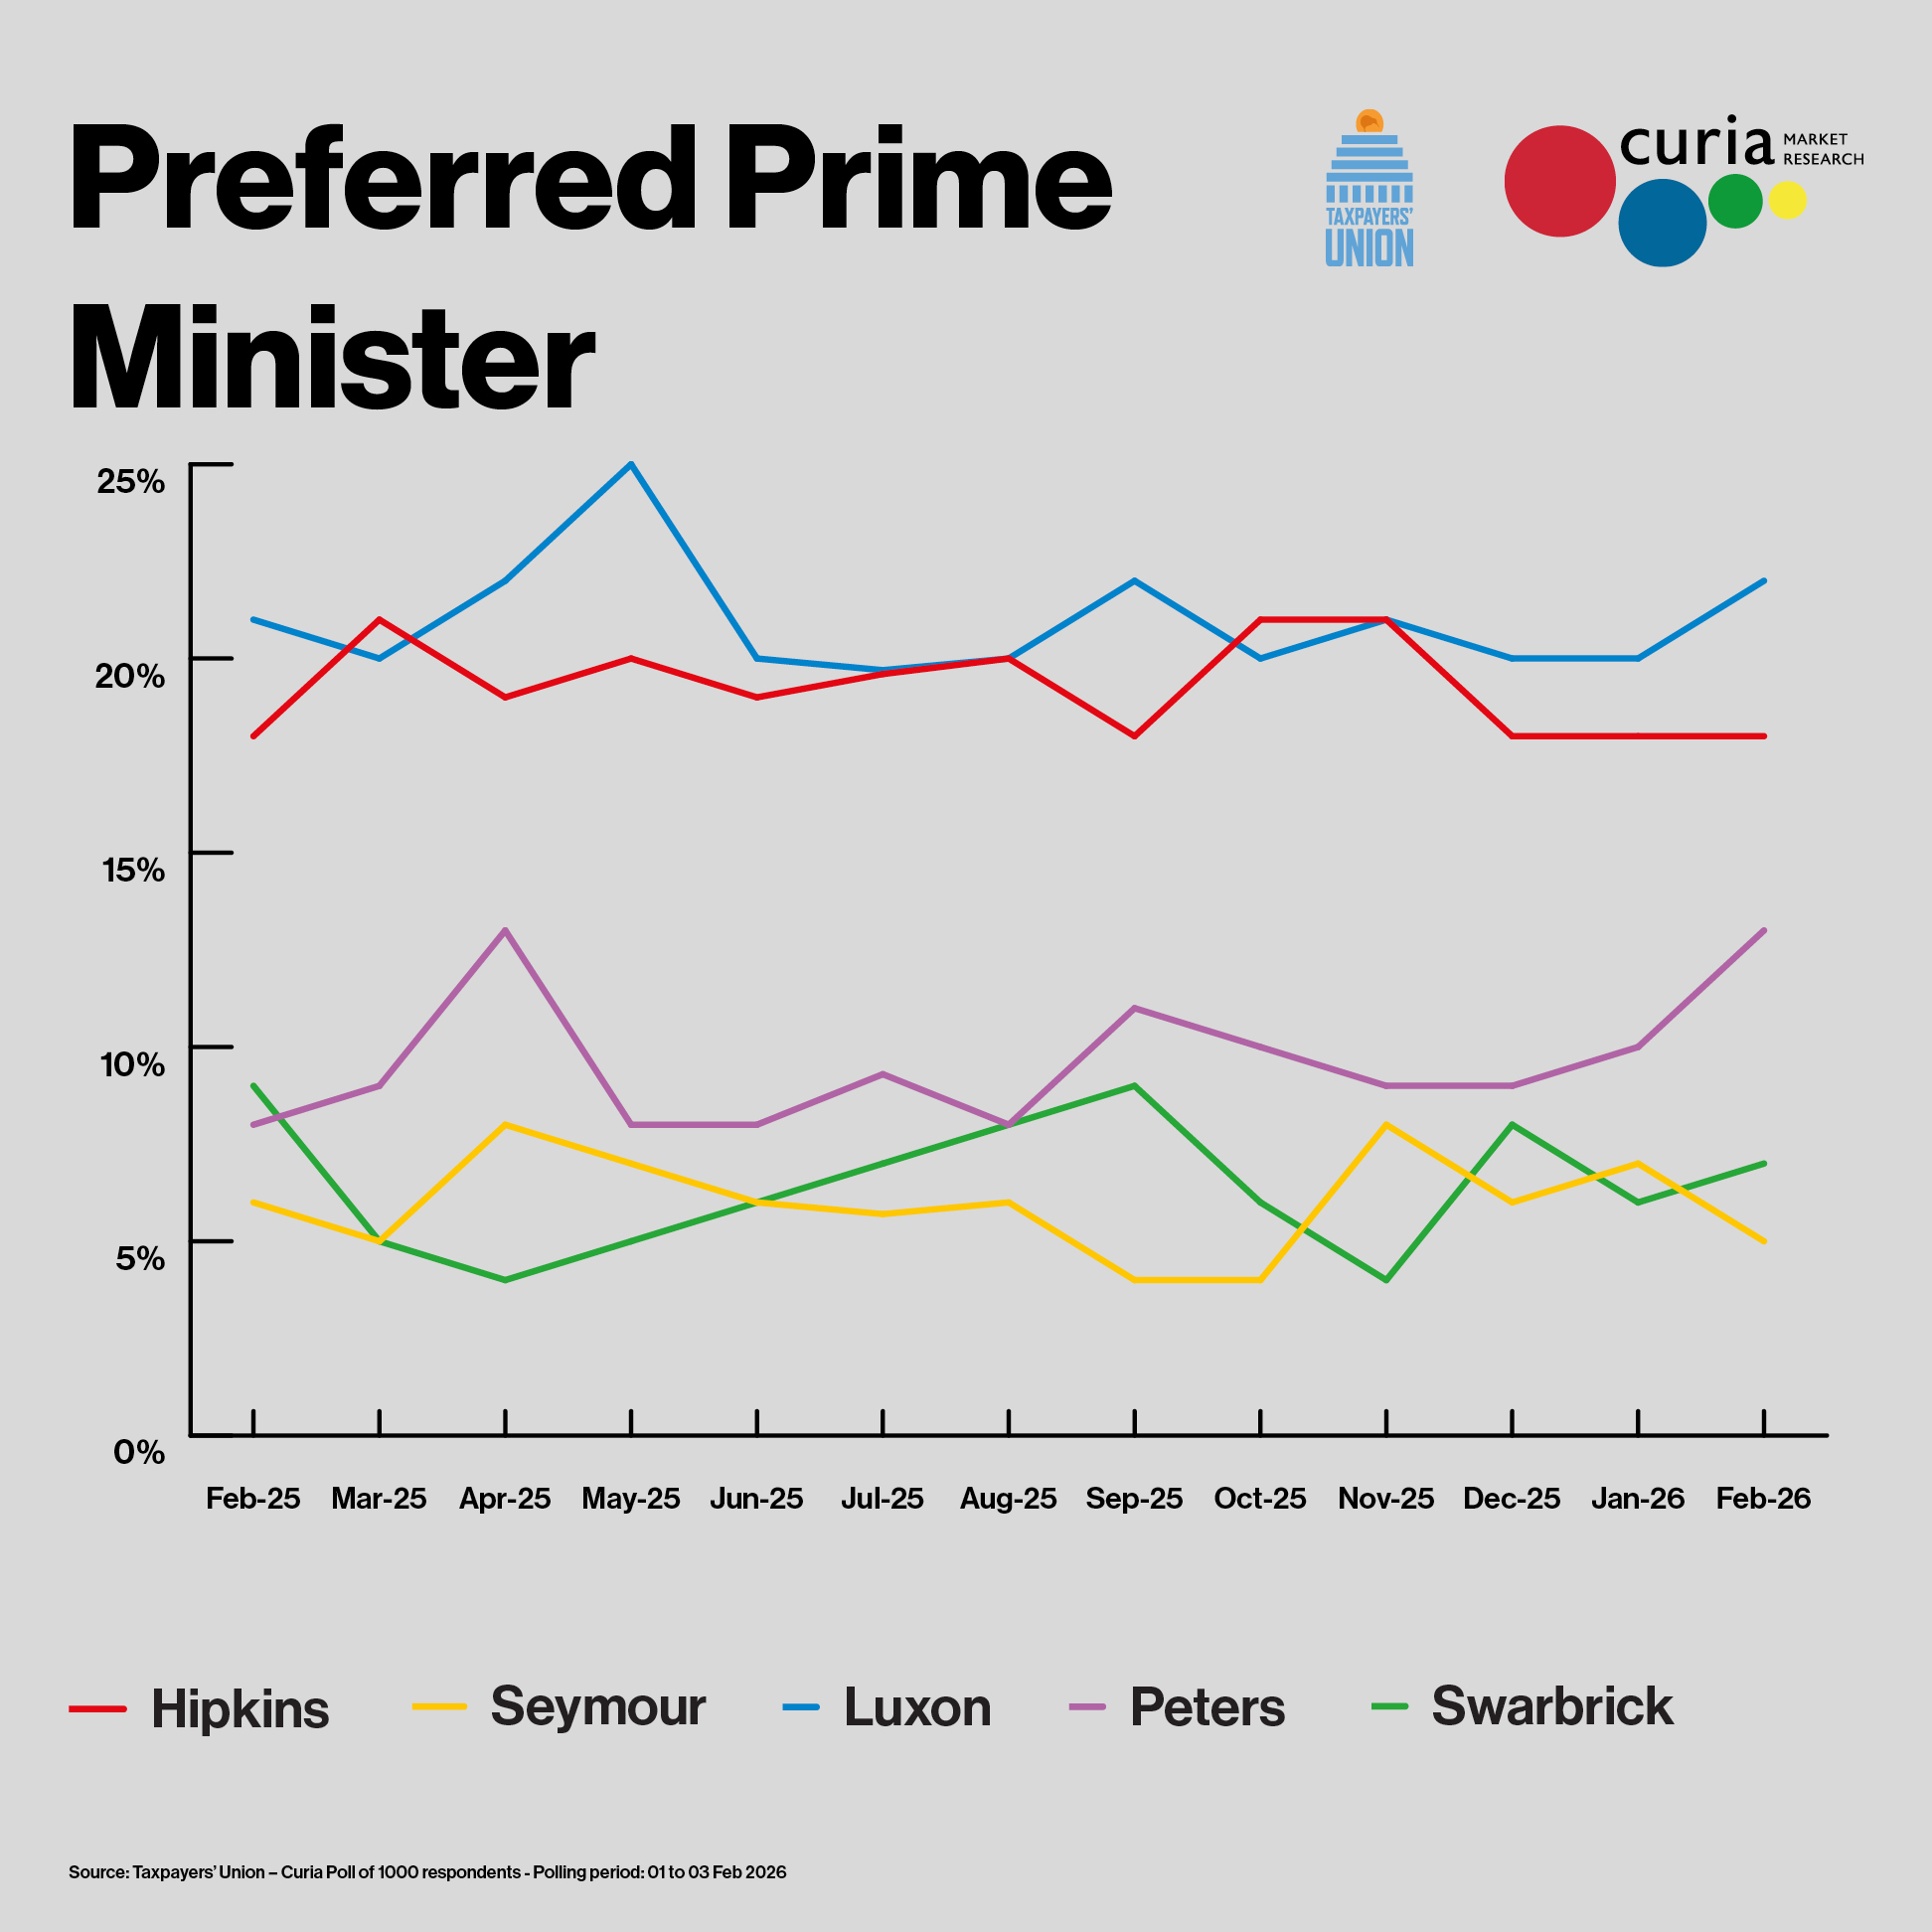
Christopher Luxon gains 2.5 points to 22.0%, while Chris Hipkins remains unchanged on 18.0%.
Winston Peters gains 2.8% to 12.5%, Chlöe Swarbrick gains 1.2 points to 6.7%, and David Seymour drops 2.3 points to 4.8%.
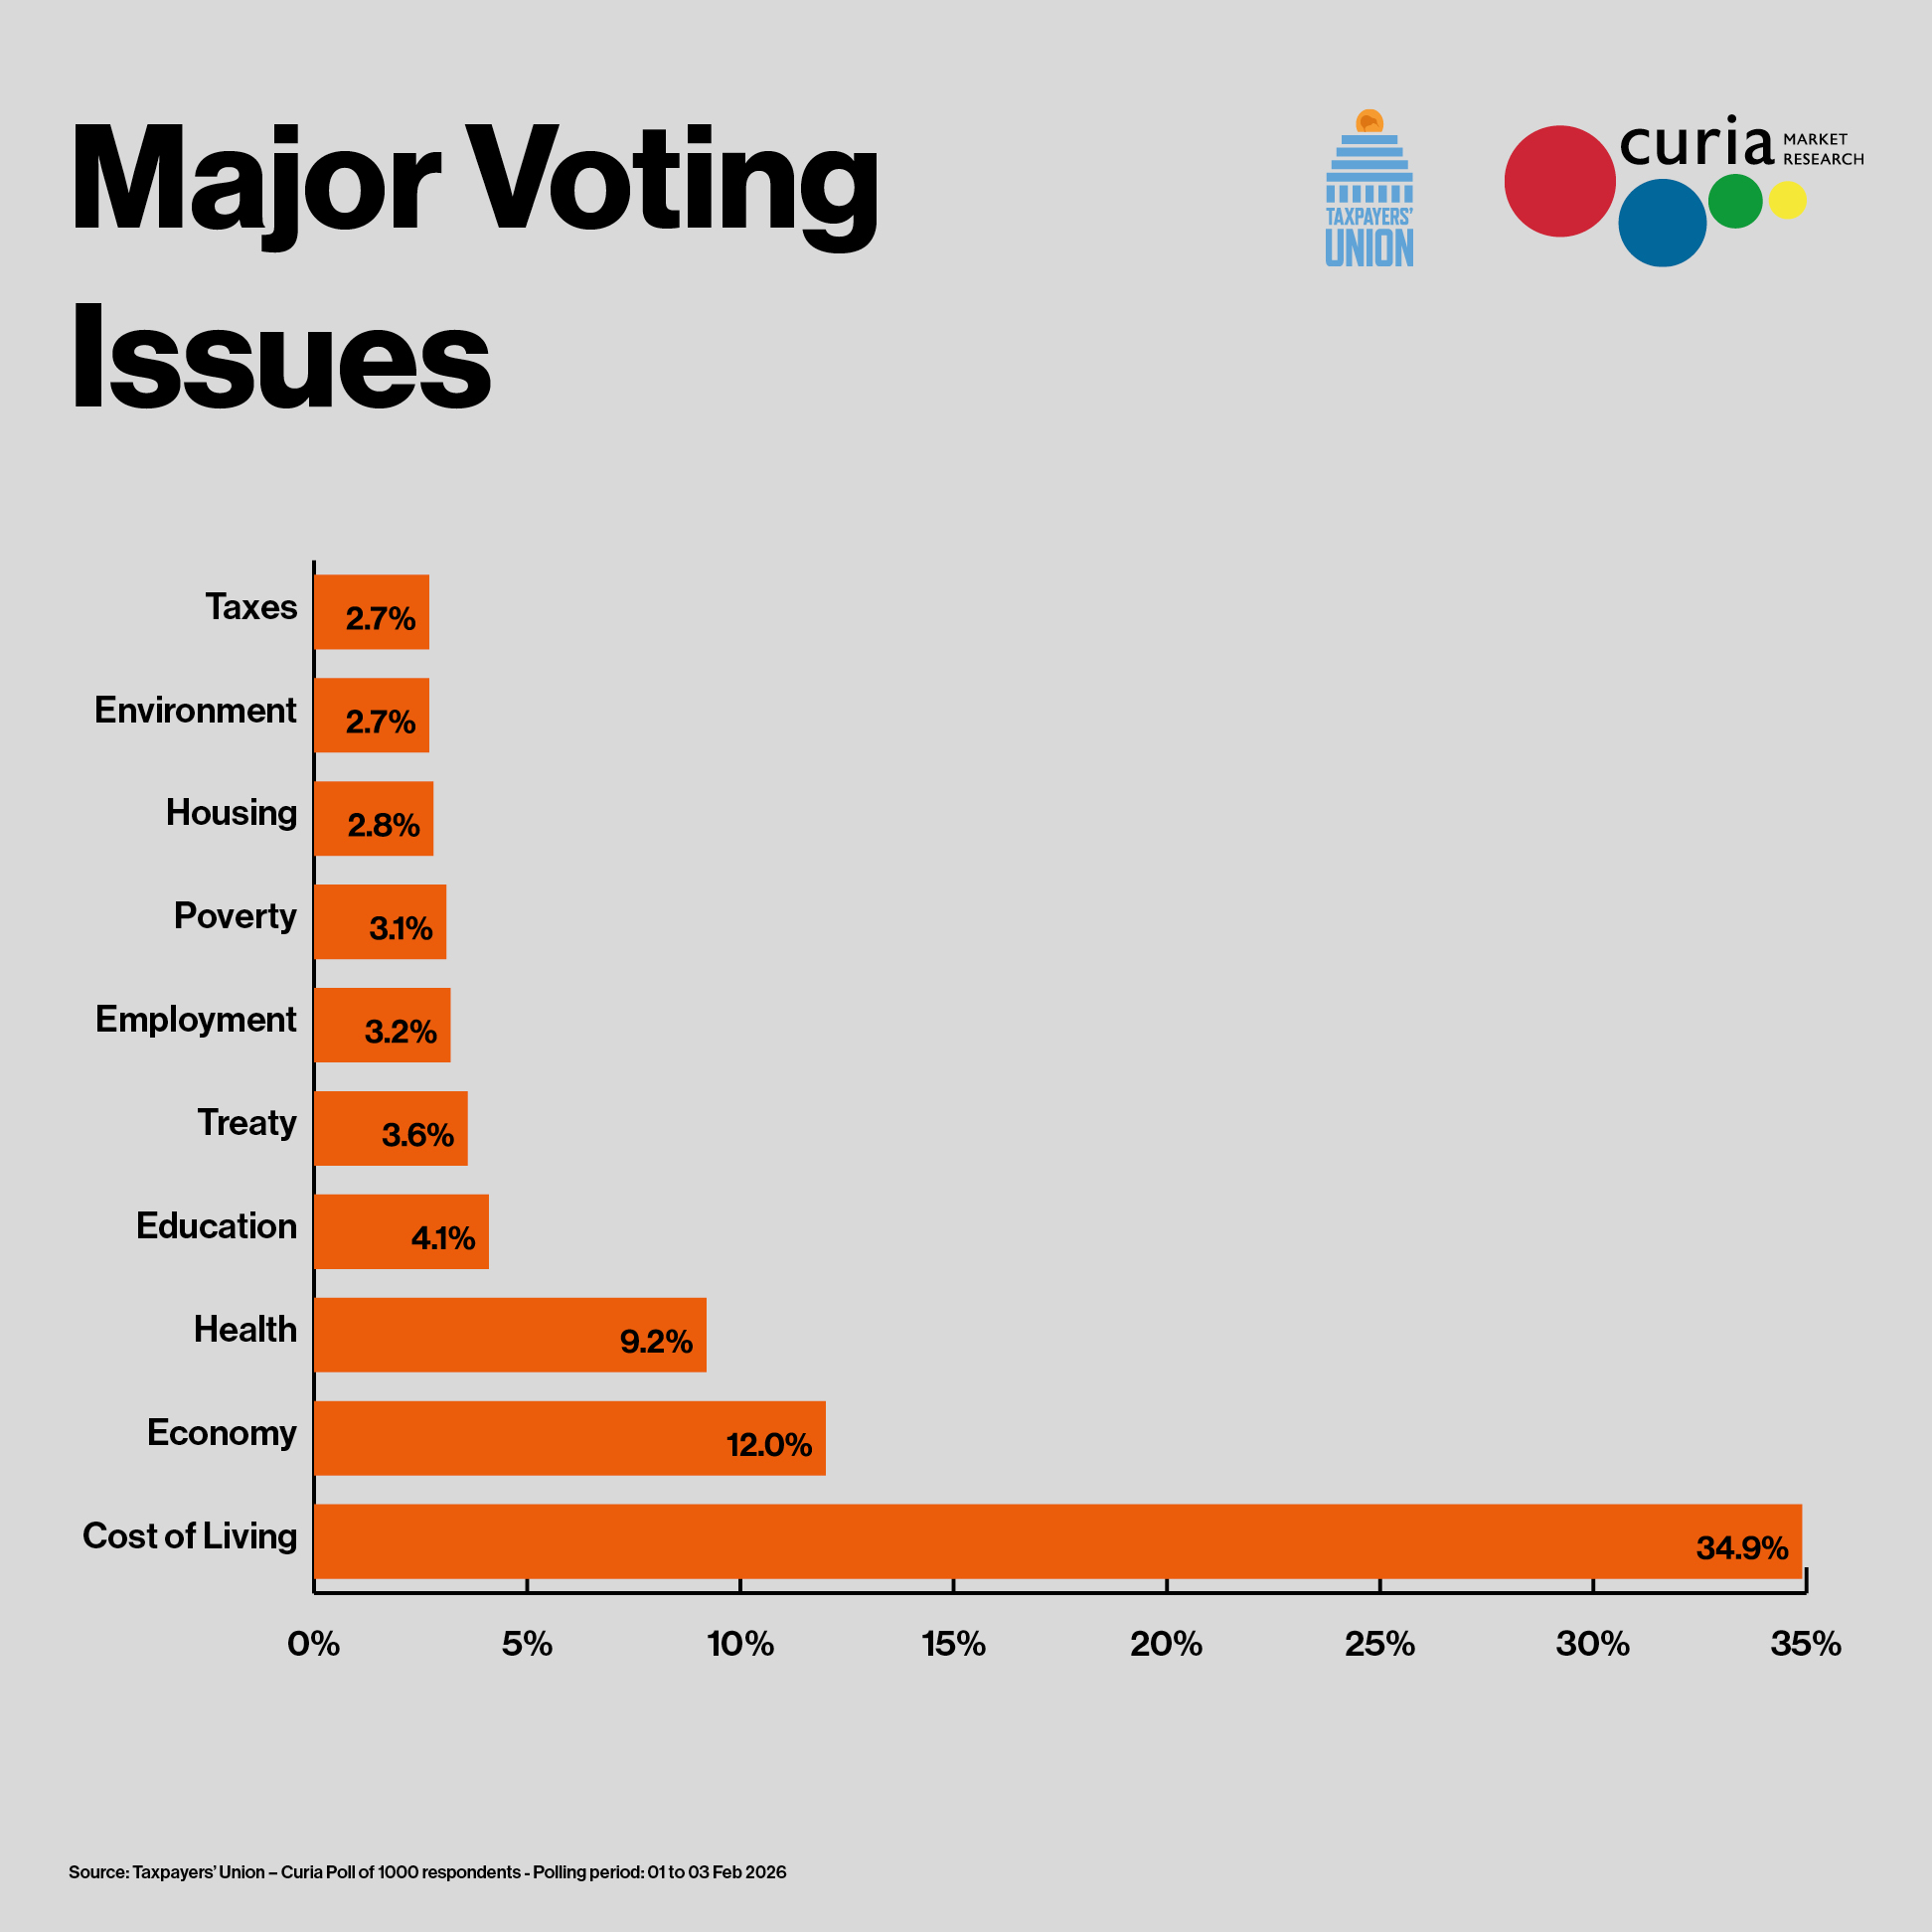
Cost of Living remains the most important issue, jumping 7.4 points to 34.9%. The Economy more generally follows on 12.0% (-2.8 points). Health is in third on 9.2% (+0.4 points), followed by Education on 4.1% (+1.5 points) and Treaty on 3.6% (+0.6 points).
For the full polling report, covering the detailed insights the Prime Minister and Leader of the Opposition are use to receiving, join our Taxpayer Caucus – our club of most generous financial supporters who make our work possible.
Media Summary Statement
This poll should be formally referred to as the “Taxpayers’ Union-Curia Poll”.
Any media or other organisation that reports on this poll should include the following summary statement:
The poll was conducted by Curia Market Research Ltd for the Taxpayers’ Union. It is a random poll of 1,000 adult New Zealanders and is weighted to the overall adult population. It was conducted by phone (landlines and mobile) and online between Sunday 01 February and Tuesday 03 February 2026, has a maximum margin of error of +/- 3.1% and 6.8% were undecided on the party vote question.
Notes
The scientific poll was conducted by Curia Market Research and commissioned by the New Zealand Taxpayers’ Union. The full polling report is being released exclusively to members of our Taxpayer Caucus. As is well known, but for full disclosure, David Farrar co-founded the Taxpayers' Union and previously served on its board. He is also a Director of Curia Market Research Ltd.
The Taxpayers’ Union – Curia Poll was conducted from Sunday 01 February and Tuesday 03 February 2026. The median response was collected on Monday 02 February 2026.
The target population is adults aged 18+ who live in New Zealand and are eligible and likely to vote. The sample population is adults aged 18+ who live in New Zealand and are eligible and likely to vote who are contactable on a landline or mobile phone or online panel. 1,000 respondents agreed to participate, 700 by phone and 300 by online panel. The number of decided voters on the vote questions was 920. There were 68 (6.8%) undecided voters and 12 (1.2%) who refused the vote question.
A random selection of 10,000 NZ phone numbers (landlines and mobiles) and a random selection from the target population from up to three global online panels (that comply with ESOMAR guidelines for online research). If the call is to a landline, the person who is home and next has a birthday is asked to take part. Those who take part through an online panel are excluded from further polls on the same topic for six months.
Multiple call-backs occurred to maximise the response rate. Those who said they were unlikely or very unlikely to vote were excluded.
The poll was part of a wider omnibus survey for multiple clients. Questions on voting sentiment are asked before any other questions. The questions were asked in the order they are listed.
The results are weighted to reflect the overall voting adult population in terms of gender, age, and area.
Based on this sample of 1,000 respondents, the maximum sampling error (for a result of 50%) is +/- 3.1%, at the 95% confidence level. Results for sub-groups such as age and area will have a much higher margin of error and not seen as precise.
The polling questions and the order in which they were asked can be found here.


